For Realism, the leading international relations theory, differences in military power have grave importance in understanding international politics. Power transition and hegemonic stability theories also look at fluctuations in military powers of states within the international system. Since the publication of David A. Lake’s book in 2009, hierarchy theory has become quite popular among international relations students, resulting in its proponents to look primarily at the military power of states in defining hierarchical orders. According to the hierarchy approach, material capabilities (military and economic power) are important simply because “hierarchical order” is used “as a synonym for the distribution of capabilities”[1] among states. By this, hierarchy scholars mean that it is the distribution of material capabilities that situates the lead state and its subordinates in a hierarchical order. Since the power capacities of the leading state play a key role in enforcing rules of the order and the punishment of deviant behavior, it is of primary importance to look at the changes in military power of states within the hierarchical order in question.
Despite its key importance in the assessment of Turkey’s status in world politics, estimating military power is particularly difficult because of weak measurement methods. Traditional studies are heavily based on data on defense expenditure and the number of military personnel. Recent studies increasingly use David Singer’s Correlates of War (CoW) dataset for the assessment of Turkey’s material power. This paper proposes alternative measurement methods and uses the evolution of Turkey’s military capacity in the 2000s as a case study. In doing this, the paper will first provide a brief background of Turkey’s search for domestic defense industry. Secondly, the paper will try to show why defense expenditure and military personnel data in Correlates of War can be misleading in the assessment of Turkey’s military power. It will then introduce two complementary methods, net military resource data and defense industry data, in order to better measure Turkey’s changing military capacity in the 2000s.
A Brief Historical Background
Turkey’s place in the US-led order, namely NATO, is primarily determined by its relative power capacity. As a militarily weak country, Turkey joined the US-led order to ensure protection against Soviet threats after the Second World War. Since then, the military capacity of Turkey remained highly dependent on US aids. Whenever US policymakers forced Turkey to behave against its own interests, Ankara invested in its domestic defense industry with the aim of increasing its autonomy. Therefore, it is not a coincidence that Turkey started many domestic defense companies after the US arms embargo in 1974.[2] As Gülay Günlük Şenesen, Professor at Istanbul University rightly puts it, the US embargo created “an awareness of the need to become self-sufficient in arms production, to avoid the restrictions attached to military aid.”[3] The US was supplying “over 90 percent of Turkey’s military equipment” [4] at the time, and therefore Ankara decided to invest in an indigenous defense industry. As part of this new motivation, ASELSAN[5] started to produce military electronic parts in 1977. During the mid-1980s, many military companies such as the Turkish Aircraft Industries Cooperation (TUSAS) and Turkish Aerospace Industries (TAI) joined Turkey’s domestic defense industry.
Despite its key importance in the assessment of Turkey’s status in world politics, estimating military power is particularly difficult because of weak measurement methods.
The same motivation influenced Turkish policymakers in the 1990s. As a result of the partial arms embargo imposed by Germany and the US, the Turkish Armed Forces started a military modernization project to improve its fight against the terrorist group PKK. In line with this project, Turkey not only bought new military equipment from Israel, but also cooperated with Israel in order to improve its defense industry. The 2000s witnessed other important developments as well. In the aftermath of the 2001 economic crisis, the Turkish economy performed well,[6] as demonstrated by the increase of its GDP from 200 billion dollars in 2001 to 950 billion dollars in 2013.[7] Such a massive improvement in Turkey’s economic capacity underpinned further development in Turkey’s military capacity. In the 2010s, Turkey became comparatively less dependent on US military aid as a result of its domestic defense industry and diversification of arms sources.
CINC Scores of Turkey
Despite many available methods to systematically assess a country’s national power, some of these methods have lost their credibility due to the inclusion of immeasurable indicators such as national morality and national character.[8] In order to make an objective assessment, researchers removed incalculable indicators from their formula of national power. For example in 1960, Clifford German developed a formula to ascertain national power by using five different measurable indicators: nuclear capability (N), land (L), population (P), industrial base (I), and military size (M). In his formula, National Power = N(L+P+I+M), nuclear capacity has prime importance because of its multiplier effect.[9] By using measurable indicators, David Singer published Correlates of War (CoW) in 1972, a research project that collects empirical data on large scale conflicts around the world. As part of the CoW project, Singer created the Composite Index of National Capability (CINC) as a statistical measure of national power. Since then, an enormous body of scholars have used CINC to estimate the material capacities of states. In assessing the power of any country in question, CINC combines six annual indicators of material capabilities: military spending, troops, population, urban population, iron and steel production, and energy consumption. While the combination of these indicators for each country determines their place in the international system, changes in these indicators over the years for a specific country is used to asses how and when power transition occur.
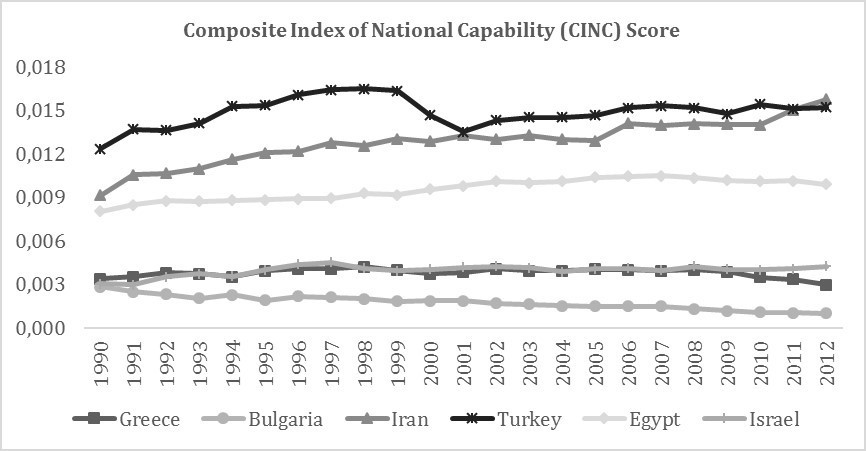
Figure 1 compares Turkey’s scores together with that of the regional states and shows that while Iran’s score steadily increases, all other country’s scores remain relatively stable. Moreover, Iran’s CINC score exceeds Turkey’s in 2012. A closer look at the variation in Turkey’s CINC score shows that Turkey’s material power experiences a steady increase until 1998, a sharp drop between 1999 and 2002, and finally a comparatively slower increase after 2002. From this result, a researcher can infer that there is no significant improvement in Turkey’s material capacity from 2000 to 2012. Moreover, CINC scores imply that Turkey’s material capacity in 1998 was better than its material capacity in 2012.
Figure 1[10]
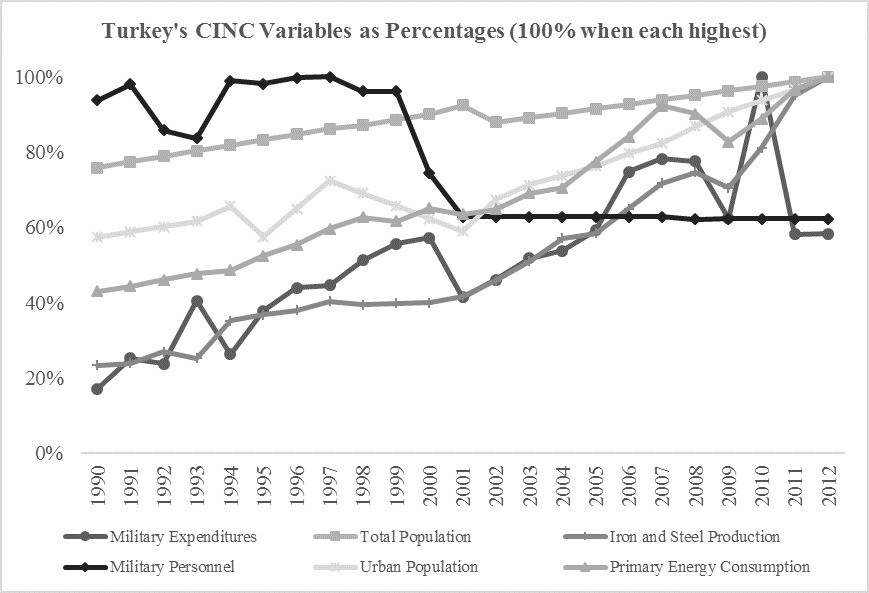
In order to understand which indicator caused the sharp drop in Turkey’s CINC score, we can individually look at the variations in each indicator. Figure 2 clearly shows that the most visible drop between 1999 and 2002 is in military personnel indicator. While population, enegy consumption, and steel production increase during the time frame in question, military spending and troop indicators experience sharp decreases. The data on military personnel and military expenditures in Figure 2 explains the sharp drop in Turkey’s CINC score between 1999 and 2002. One must note that the effect of the dramatic drop in troop number on Turkey’s overall score raises questions about the reliability of CINC data, given the fact that the significance of manpower has declined greatly over the last century as a result of a shift from labor-intensive to capital-intensive warfare.
Figure 2[11]
Many scholars, however, questioned the reliability of CINC scores in recent years.[12] For example, in the case of the figures above, the data on military personnel systematically exaggerates military capabilities of populous countries. A comparison between Israel and Egypt in Figure 1 indicates that Egypt is far stronger than Israel. If a country feeds a large army, it has to allocate more money for defense, resulting in high military expenditure. As Michael Beckly rightly points out, “a country with a big population might produce vast output and field a large army, but it also may bear massive welfare and security burdens that drain its wealth and bog down its military, leaving it with few resources for power projection abroad.”[13] So, keeping in mind Beckly’s criticism, how can we rely on CINC scores in assessing power capacities of state?
In the 2010s, Turkey became comparatively less dependent on US military aid as a result of its domestic defense industry and diversification of arms sources.
Despite questions surrounding CINC scores, scholars of Turkish politics continue to use the data at hand. For example, Hatipoğlu and Palmer use CINC scores to legitimize one of their hypotheses according to which “as Turkey becomes stronger, it will increasingly resort to foreign policy initiatives geared toward changing the status quo.”[14] For them, CINC scores “strongly suggest that Turkey’s capabilities grew considerably during the 2000s.”[15] However, their figure of CINC scores shows the opposite. As seen in Figure 1 above, Hatipoğlu and Palmer’s figure only indicates that after a sharp decrease between 1999 and 2002, Turkey’s national capacity is unable to reach its 1998 level (0,0165) in 2008 (0,0152). Therefore, it is unclear how Hatipoğlu and Palmer came to the conclusion that Turkey became stronger in the 2000s than it was in the late 1990s. If military expenditure and military personnel data in Correlates of War are not so reliable, do we then have other indicators to measure the military capacity of any state in question?
Net Military Resource Data
Following Beckley’s advice to use net data instead of gross data, it is possible to measure net stocks of military resources by deducting security costs. A comparative look at military personnel and military expenditure metrics (Figure 2) imply that Turkey’s military capacity improved throughout the 2000s simply because military expenditure continued to increase between 2001 and 2010, despite the sharp decrease in the cost of keeping large military personnel. That means Turkey’s military power improved in the 2000s simply because military expenditure dramatically increased while the military personnel needed resources was kept at a minimum. Since gross military data gloss over the decrease in the cost of keeping large military personnel, the CINC scores of Turkey in the 2000s yield wildly inaccurate estimates of Turkey’s military power.[16] For this reason, Turkey’s net military recourse data as an indicator is better than Turkey’s gross military resource data. However, reliable data on the percentage of personnel spending such as salaries, benefits , and pension payments in the general defense budget is not available.[17] Therefore, calculating the net military resource of Turkey is a difficult task.
Turkey started to demand greater autonomy in its relations with regional actors and challenged the rules and dictates of the US.
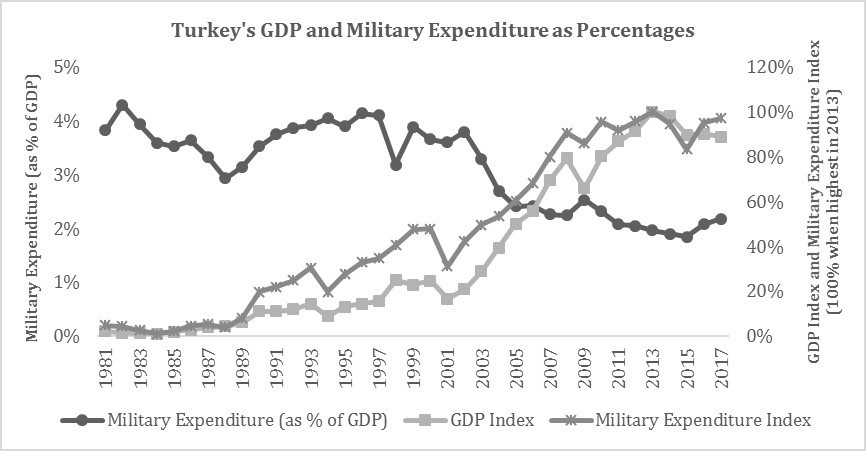
Despite the lack of net resource data, a comparative look at three indicators: GDP, military expenditure, and military expenditure as of GDP provides a clearer picture of the changing military capacity of Turkey throughout the 2000s. Figure 3 suggests two important implications. First, while military expenditure as of GDP remained relatively stable throughout the 1990s, it dramatically decreased in the 2000s. The fact that the burden of defense spending decreased on the overall budget implies that the Turkish economy in the 2000s was stronger than the 1990s. Second, the Turkish state reduced the number of military personnel between 1999 and 2002, resulting in a decrease in personnel spending. Despite this, military expenditure continued to increase especially between 2001 and 2008. These two implications clearly prove that Turkey’s net military capacity increased throughout the 2000s. This is what Correlates of War dataset fails to show.
Figure 3[18]
Indigenous Defense Industry Data
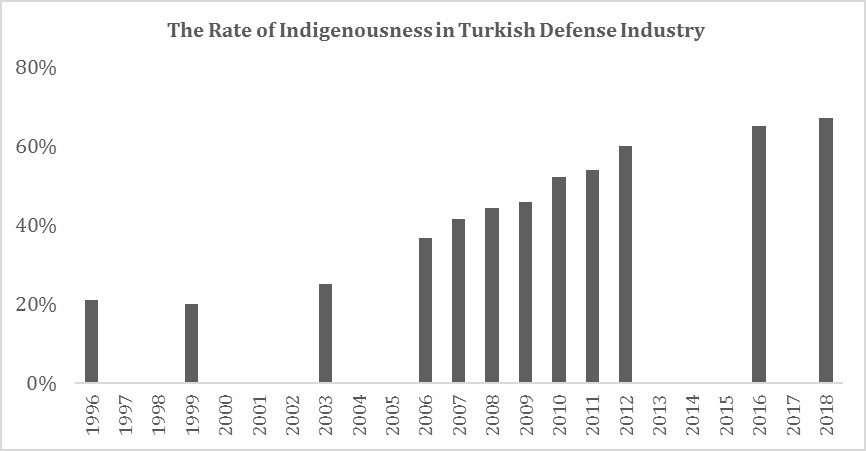
For subordinate countries in a hierarchical order, measuring the military dependency of the subordinate on the lead state of hierarchy has more explanatory power than net military resource data. Studies show that “the sourcing of major conventional weapons is conditioned by the patterns of hegemonic relations.”[19] If a subordinate state is embedded in a hegemon’s security hierarchy, it is likely to buy arms from this hegemon. Such an arms transfer creates and consolidates the dependency of subordinate states on the hegemon. Aiming to decrease this dependency, subordinate states either invest in domestic defense industry[20] or buy arms from rival hegemons. Throughout the 2000s, Turkey preferred to invest in the indigenous defense industry. Figure 4 illustrates the changing ratio of Turkey’s indigenous defense industry to meet its domestic defense needs. Starting in 2006, there is a dramatic increase in the share of indigenousness of its defense industry, as shown in the rise from 20 percent in 1999 to 67 percent in 2018. Unlike the CINC scores and despite some missing data, Figure 4 implies that Turkey’s military capacity improved in the 2000s while it remained stable in the 1990s. Needless to say, this has reduced the dependency of the Turkish military on external sources in the procurement of high-tech products.
Figure 4 [21]
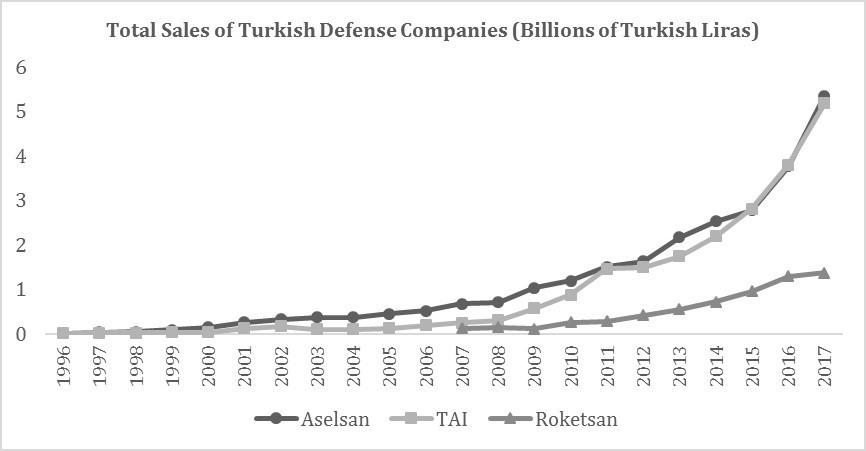
Another related indicator is the capacity of the indigenous defense industry in international markets. This is important because such capacity not only shows the competitive power of domestic weapons but also generates the influence[22] of Turkey over buyers. The share of the Turkish defense industry in the international market shows the technological strength of this industry. This is the most important aspect of the military power, which standard metrics such as CINC largely miss.[23] State companies such as ASELSAN, TAI, and Roketsan and private companies such as Bayraktar have dramatically increased their sales to international markets after 2008. According to the SIPRI Arms Industry Database, ASELSAN and TAI are among top-selling 100 companies in 2010 and 2014, respectively. The same database shows that while ASELSAN was 61st on the list of top selling companies, TAI was 70th in 2017. Figure 5 indicates that three state-owned companies have a greater share of the global market especially after 2008.
Figure 5[24]
Conclusion
Unlike Singer’s CoW dataset, the net military capacity and the ratio of the indigenous defense industry to meet domestic military needs clearly shows that there is a striking improvement in Turkey’s military capacity in the 2000s. As Hatipoğlu and Palmer rightly stated, a dramatic improvement in military capacity resulted in foreign policy initiatives aimed at changing the status quo. More important than regional initiatives, a significant increase in military capacity during the 2000s has reshuffled Turkey’s place and role in the US-led order. As a result, Turkey started to demand greater autonomy in its relations with regional actors and challenged the rules and dictates of the US. Since militarily powerful countries are less willing to trade their own autonomy for external protection, Turkey’s changing military capacity will have a dramatic impact on the relations between Ankara and Washington.
[1] David A. Lake, Hierarchy in International Relations (Ithaca: Cornell University Press, 2009), p. xi and 61; Lake’s book (together with his earlier articles) is a founding text of the hierarchy approach in the field of international relations.
[2] Especially in the 1980s, Turkey made important investments that established the foundation for the future Turkish defense industry. For early defense investments of Turkey, see, Hüseyin Bağcı, and Çağlar Kurç, “Turkey’s strategic choice: buy or make weapons?” Defence Studies, Vol. 17, No. 1 (2017), pp. 38-62.
[3] Gülay Günlük-Şenesen, “Turkey: The Arms Industry Modernization Programme,” in Herbert Wulf (ed.), Arms Industry Limited (Oxford: Oxford University Press, 1993), p. 255.
[4]Laurie Van Hook (ed.), Foreign Relations of the United States, 1969–1976, Vol. XXX, Greece; Cyprus; Turkey, 1973–1976, (Washington, DC: Government Printing Office, 2007).
[5] ASELSAN is a Turkish corporation that produces tactical military radios and defense electronic systems for the Turkish Armed Forces.
[6] Emel Parlar Dal (ed.), Middle Powers in Global Governance: The Rise of Turkey (Cham: Palgrave Macmillan, 2018).
[7] Ziya Öniş and Mustafa Kutlay, “Rising Powers in a Changing Global Order: the Political Economy of Turkey in the Age of BRICs,” Third World Quarterly, Vol. 34, No. 8 (2013), p. 1414.
[8] Hans J. Morgenthau, Politics Among Nations: The Struggle for Power and Peace, (New York: Alfred A. Knopf, 1978).
[9] F. Clifford German, “A Tentative Evaluation of World Power,” Journal of Conflict Resolution, Vol. 4, No. 1 (1960).
[10] J. David Singer, “Reconstructing the Correlates of War Dataset on Material Capabilities of States, 1816–1985,” International Interactions, Vol. 14, No. 2 (1988).
[12] See for example, Kelly Kadera, and Gerald Sorokin, “Measuring national power,” International Interactions, Vol. 30, No. 3 (2004), pp. 211-30; Michael Beckley, “The Power of Nations: Measuring What Matters,” International Security, Vol. 43, No. 2 (Fall 2018).
[13] Beckley (Fall 2018), p. 9.
[14] Emre Hatipoğlu and Glenn Palmer, “Contextualizing Change in Turkish Foreign Policy: the Promise of the ‘two-good’ theory,” Cambridge Review of International Affairs, Vol. 29, No. 1 (2016), p. 240; See for another study using CINC scores for assessment, Emel Parlar Dal, “On Turkey's Trail as a ‘Rising Middle Power’ in the Network of Global Governance: Preferences, Capabilities, and Strategies,” Perceptions, Vol. 19, No. 4 (2014).
[15] Hatipoğlu and Palmer (2014).
[16] Michael Beckley, Unrivaled: Why America Will Remain the World’s Sole Superpower, (Ithaca: Cornell University Press, 2018), p. 16.
[17] Beckley (Fall 2018).
[19] Vucetic, Srdjan, and Atsushi Tago, “Why Buy American? The International Politics of Fighter Jet Transfers,” Canadian Journal of Political Science/RevueCcanadienne de Science Politique, Vol. 48, No. 1 (2015): p. 102.
[20] Edward A. Kolodziej, Making and Marketing Arms: the French Experience and its Implications for the International System, (Princeton: Princeton University Press, 1987).
[21] Aytekin Ziylan et al., Savunma Sanayi ve Tedarik (Ankara: TÜBİTAK Yayınları, 1998), p. 41; Aytekin Ziylan, Savunma Sanayi Üzerine (Ankara: 1999), p. 51; “Activity Report 2011,” The Undersecretariat for Defence Industries, 2011, http://www.sp.gov.tr/upload/xSPRapor/files/dcaoK+2011_Yili_Faaliyet_Raporu.pdf; “The Performance Programme 2014,” The Undersecretariat for Defence Industries, 2014, https://www.ssb.gov.tr/Images/Uploads/MyContents/F_20170523144711700156.pdf; “The Performance of the Turkish Defence Industries in 2016,” The Republic of Turkey Presidency of Defense Industries, 2016, https://www.ssb.gov.tr/WebSite/contentList.aspx?PageID=48&LangID=1; “Binali Yıldırım: Savunmada yüzde 67 yerlilik oranına ulaştık,” Hürriyet, 18 November 2018, http://www.hurriyet.com.tr/gundem/binali-yildirim-savunmada-yuzde-67-yerlilik-oranina-ulastik-41023130
[22] Keith Krause, “Military statecraft: Power and influence in Soviet and American arms transfer relationships,” International Studies Quarterly, Vol. 35, No. 3 (1991), pp. 313-36.
[23] Beckley (Fall 2018).
[24] The rates of arms sales for Aselsan, TAI and Roketsan are around 97 percent, 86 percent, and 100 percent of total sales respectively. “Turkey’s Top 500 Industrial Enterprises, 1993-2016,” ISO 500, http://www.iso500.org.tr/about-iso-500/data-from-previous-years/; “Annual Reports,” ASELSAN, https://www.aselsan.com.tr/en-us/InvestorRelations/Pages/Annual-Reports.aspx; “Turkish Aerospace Industry,” Fortune Turkey, http://www.fortuneturkey.com/fortune500?yil=2017&fcode=tusas-turk-havacilik-ve-uzay-sanayi-as-F277882; “Roketsan Rocket Industries and Trade,” Fortune Turkey, http://www.fortuneturkey.com/fortune500?yil=2017&fcode=roketsan-roket-sanayi-ve-ticaret-as-F272821.