The rise of Southern economies has given hope to millions of being lifted out of abject poverty. New jobs and new sources of income have generated aspirations and multiplied the efforts of these countries for a higher quality of life. However, this very phenomenon has also given rise to contestations and conflicts across the globe. The recent escalation in the US-China trade conflict is a case in point. It is important for emerging economies to excel in technology and in domestic production without conflicting with global norms, trade rules, and related regulations. In the knowledge economy, technology and cost-effective production are the two important instruments for mastering the art of value-chain development. These instruments would eventually disregard simultaneous modifications in the social and economic stratifications, which these emerging economies are going through.[1]
The emerging economies are creating their own niche in the development process, and occupying a notable place in the knowledge economy. If one looks back in the evolution of the trade in the agricultural and associated manufacturing goods, an interesting scenario is emerging for future strategies. On a broader level, the real manufacturing trade and the agriculture trade expanded at similar rates in the 1980s, but in the 1990s manufacturing expanded and agriculture decelerated at the global level in general and for developing countries in particular. Real manufacturing export growth increased at almost 8.5 percent between 1990 and 2006 while agricultural trade significantly decelerated from close to 6 percent in 1990-2000 to 1.5 percent during 2001-06. It was much later that the trends reversed with greater and faster trade in agricultural goods along with the initial slowing of trade in manufactured goods, which eventually declined in comparison to agricultural goods. This has significant imperatives on global trade.
This article makes an effort to analyze how trends at the sectoral level are resetting the stage with the rise of Southern economies. The article analyzes agricultural trade in the world economy through an empirical investigation. The framework covers 32 Developed Economies, 120 Developing Economies with 38 Least Developed Countries (LDCs) and 19 Emerging Economies for the period between 2002-2017. The article covers data from different sources in case of agro-product groups. It also covers the harmonized system of trade classification through Chapter 1 to 24. In this, around 435 primary products are covered. The Broad Economic Classification (BEC) Revision four is leveraged to cover agro-based products which are 100 in numbers and for processed food HS Section four and OECD Classification 1995 is used. Since there is no international classification for agricultural implements (58), an effort has been made to cover a wide range of them. The following section analyzes the trend in agriculture and manufacturing, succeeded by a detailed analysis of how emerging economies are placing themselves ahead of the growth curve. The last section draws broad conclusions, and in the process, also suggests a way forward also.
The emerging economies are creating their own niche in the development process and occupying a notable place in the knowledge economy.
Trends in Agriculture and Manufacturing
Real manufacturing export growth increased at almost 8.5 percent between 1990 and 2006 while agricultural trade decelerated significantly from close to 6 percent in 1990-2000 to 1.5 percent between 2001-2006. The low growth rate of agriculture exports compared to manufactured goods exports over the decades resulted in the decline in the share of agricultural exports in the global trade.[2]
Many factors are responsible for this disparity in the growth rate of agriculture and manufacturing. A robust rise in manufacturing trade was due to a significant reduction in average tariffs on manufacturing products under the General Agreement on Tariffs and Trade (GATT); reduction in transportation cost; establishment of global value chains (GVC) in manufacture products, which led to rapid expansion of intra-industry trade, and the rise in global income, which relatively increased demand for manufactured goods. Earlier, slowdown in the growth of agriculture exports was due to the failure of completely including agriculture under the GATT negotiations. This resulted in higher tariffs on agriculture commodities and domestic support policy for agriculture, which fostered import substitution and saturated markets in the developed countries due to low-income inelasticity.[3]
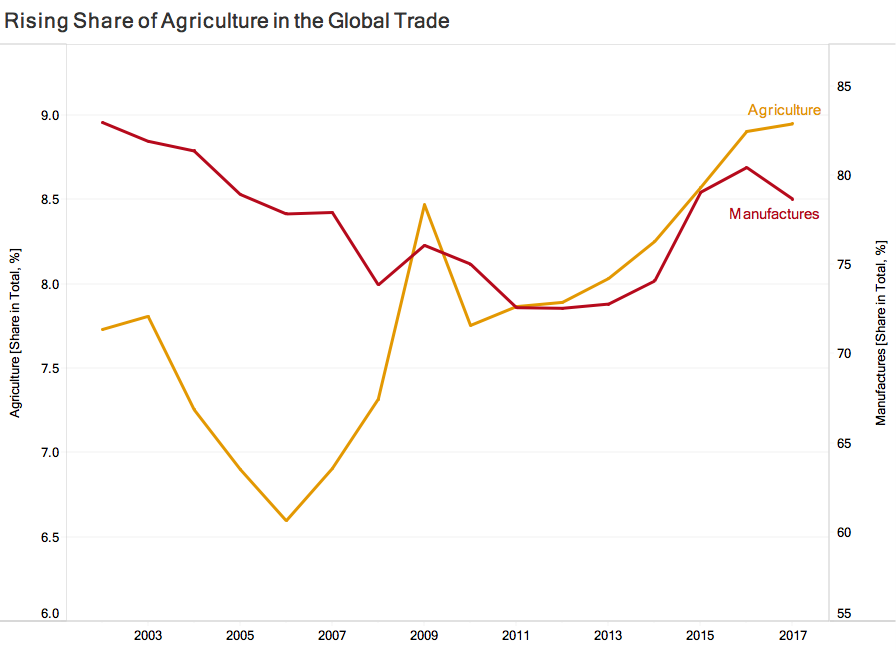
However, trends have reversed during the last two decades—the share of agriculture trade is expanding while the share of manufactured products is declining. For instance, the share of agriculture in global trade has declined to almost 6.5 percent in 2006 from 7.7 percent in 2002. And since then, agriculture share in global trade has rebounded and reached 8.5 percent in 2009 and further to 8.8 percent in 2017, demonstrating that the sectoral share has expanded persistently despite the recession. Conversely, the share of manufacturing in global trade has declined from 85 percent in 2003 to almost 75 percent in 2008, plunging further to 74 percent in 2011 which illustrates the sharp and significant impact of global sub-prime mortgage crises. Following the crises, the share of manufacturing in global trade has been increasing since 2014 and reached almost 80 percent in 2017 (Figure 1).
Figure 1: Trends in Share of Agriculture and Manufacturing in World Trade
An Overview of Global Trade in Primary Products
Global exports of primary products (goods that are available from cultivating raw materials without a manufacturing process) steadily increased from 432 billion dollars in 2002 to 1,556 billion dollars in 2014. However, global exports started declining sharply since then and reduced to 1,181 billion dollars in 2017. Global exports in primary products are dominated by developed and emerging countries; with time, the share of the developed countries has reduced while the share of emerging economies has increased, signaling a declining comparative advantage of the developed countries. The share of the developed countries in the total primary goods exports was the highest; though it declined steadily from 71 percent in 2002 to 55 percent in 2017. Simultaneously, the share of the emerging economies climbed from 20 percent in 2002 to 31 percent in 2017.[4] Developing countries’ share, including LDC’s export share, has been almost constant and has witnessed a marginal improvement over the period.
Developed countries are the biggest importers of primary products, though their share in total imports is declining. The high share of the developed countries in exports and import basket indicate a significant shift of intra-developed countries trade towards primary products. Most of the trade between developed countries happened within the trading block of the EU and NAFTA. Inter-block trade accounted for one-third of the global agriculture trade, and half of this was inter-EU trade. Since the 1980s, inter-block trade has increased.[5] Besides, the share of emerging countries in total imports increased from an average of 18 percent in the period 2002-08 to 28 percent between 2011 and 2017. The share of developing countries including LDCs in total imports doubled from 9 percent in 2009 to 18 percent in 2015, and it declined marginally for the developing countries and significantly for the LDCs in 2016 and 2017. Interestingly, there is an increasing inter-dependence among developing counties for agriculture products which explains the increase in exports and imports from the developing countries to other developing countries. Similarly, the LDCs are exporting as much to the other developing countries as to the industrial countries.
In the case of developed and emerging economies, the quantum of exports and imports has been equal except for some exceptional years, however, lately, divergence has been growing. In the case of developed countries, the trade deficit increased from 46 billion in 2002 to 65 billion dollars in 2005, and thereafter it reduced to 11 billion dollars in 2009. Developed countries started registering trade surplus from 2010 onwards, which reached the highest level in 2013 at 46 billion dollars. Emerging economies trade surplus increased from 13 billion to 35 billion dollars in 2005, and declined later during the recession to one billion dollars in 2010. Trade surplus subsequently increased and reached 17.5 billion dollars in 2016.[6]
Developing countries including LDCs, on the other hand, were net importers of primary products. This suggested that though agriculture had a dominating share in their economies, its productivity was still low, leading to net trade deficit position. Over the years, the trade deficit of developing countries increased and reached 42 billion in 2014 from 5.42 billion dollars in 2002. Post 2002, the trade deficit has been in decline; however, it would be premature to conclude a declining trend. LDCs registered an increase in their trade deficit from a negligible level of 0.42 billion in 2002 to 7.5 billion dollars in 2011. Later on, it reduced, leading to a trade surplus amounting to 8.56 billion dollars in 2016.
Developed countries are the biggest importers of primary products, though their share in total imports is declining.
Global Trade in Processed Foods
With the growing industrialization of food, rising incomes, expanding urbanization, industry migration and health consciousness, the demand for processed food has multiplied manifold. During the period 1965-85, the share of processed food in global agricultural trade expanded from 40 percent to 50 percent, reaching 60 percent in 1995. In terms of quantum increase, the total processed food exports expanded from 353 billion dollars in 2002 to 824 billion dollars in 2017 with a major a boost in 2014 when trade became as high as 1334 billion dollars.
This expansion became feasible because of the improved supply and availability of processed foods due to improved technology, refrigeration, and transport facilities. Within this trade, earlier developed countries had a dominating presence, however, over the years it has declined. In 2002, the share of developed countries was as high as 73 percent which in 2017 came down to 59 percent, while that of emerging economies expanded from 12 percent to 20 percent in the same period.
There has been a strong correlation between manufactured goods exports and processed food exports. This means developed and emerging countries which are performing well in manufacturing exports are assumed to do well in processed food exports. Additionally, developing as well as emerging economies should focus on the expansion of processed food exports as these are employment- intensive, improve Terms of Trade, and have higher backward-forward linkages.[7]
Another interesting feature of trade in processed food is the declining share of developed countries in imports of processed food which means that the emerging economies are establishing themselves as a new market for such products. To illustrate, the share of the developed market in the import of processed products in global agricultural trade declined from 81 percent in 2002 to 67 percent in 2017. While that of emerging countries expanded from 12 percent to 20 percent in the same period.
The declining share of developed countries and the increasing role of emerging countries in the realm of processed food further becomes obvious through a study of the trade surplus of emerging economies economies—wherein their trade surplus increased from 29.24 billion dollars in 2002 to 113.15 billion dollars in 2013. This has provided an edge to emerging economies through achieving forward linkages for leveraging the strength of global markets and ensuring supplies by taking advantage of market access. On the contrary, in the case of developed countries and other emerging countries, import dependence has multiplied. The trade deficit of the developed countries has been consistently high with an average level of 60 billion dollars from 2010-17. For developing countries, the trade deficit was an average 20 billion dollars for the same period.
Global Trade in Agricultural Implements
Another sector with comparative advantage across emerging economies is that of agricultural implements (such as plows, threshers, axes etc.). As a country’s per capita incomes increases, the adoption of new technologies and agricultural instruments also multiplies. A positive correlation then can be drawn between the demand for agricultural implements and the per capita income of a country. Agriculture has been a more machinery-intensive activity in high-income countries vis-à-vis developing countries. This is evident in the import profile of high-income countries, reflecting a high-demand, as they are the biggest importers of agriculture implements. For instance, in 2010, tractor usage per thousand hectares of land was 15 units in high-income countries as compared to three units in upper-middle income countries.[8]
On the supply side, the flow of industrial-agricultural implements depends on the level of industrialization, sophistication of manufacturing, and their convergence with agriculture. Historically, the production of agricultural implements was dominated by industrialized countries of Western Europe, however, it is now becoming dominated by the emerging industrial countries of Asia, including China. Consequently, these countries are the largest exporters of agricultural implements.[9] The share in production and exports in emerging economies has increased remarkably. They have demonstrated a growing strength in combining their manufacturing prowess with specific knowledge of agriculture.
Globally, the gross exports of agricultural implements have tripled from 61.95 billion dollars in 2002 to 180 billion dollars in 2013. In 2013, exports started declining and dipped to 125.19 billion dollars in 2017. Developed countries dominated the global exports in agricultural implements. Out of the total exports of 62 billion dollars in 2002, developed countries accounted for 54 billion dollars. In 2017, developed countries accounted for 100 billion dollars of agricultural implement exports out of the global total of 125 billion dollars. However, with the increasing role of emerging economies in the production, the share of developed countries in global exports declined from almost 90 percent in 2002 to 2/3rd of the share since then. The loss was absorbed by emerging economies, whose share in the global export increased sharply from 9 percent in 2002 to almost 20 percent since 2010.[10]
The understanding of the demand side and supply side, along with the evolving global trends, suggests a comparative advantage of emerging developing countries in machinery exports. Developing countries including Least Developed Countries (LDCs) have had a negligible share in world exports, and this was consistently low, below 3 percent, across time. On the other hand, developed countries had a high share in imports and exports of agricultural implements, followed by emerging economies.
Having a high share in total exports and imports suggests an intra-dependence of the developed countries in agricultural implements. However, as the share of developed countries has declined over time, that of emerging countries increased marginally from an average of 18 percent in 2002- 2008 to an average of 23 percent in 2011-2017. Likewise, the share of developing countries including LDC too doubled from 5 percent in 2002 to 12 percent in 2016, thus magnifying difference between the minuscule export share and the rising import share.[11]
Over time, developed countries have maintained a trade surplus, whereas developing countries, LDCs, and emerging economies are import–dependent reflecting a trade deficit. The trade surplus of developed countries increased from 10 billion dollars in 2002 to 31 billion dollars in 2012, however, it faced a steady decline after 2012 and decreased to 14.7 billion dollars by 2017. On the other hand, the developing countries experienced a trade deficit that increased sharply from 1.5 billion dollars in 2002 to 17.8 billion dollars in 2011. However, this reduced to 7.7 billion dollars in 2017. Similarly, in emerging countries and LDCs, the trade deficit increased from 3.35 billion dollars and 0.25 billion dollars in 2002 to 7.54 billion and 3.04 billion dollars in 2012, respectively. However, in 2017 the trade deficit declined and reached 1.45 billion dollars for the LDCs. This happened as technology and the ability to finance the right kind of production structure multiplied across these countries. Interestingly, the emerging economies witnessed a trade surplus in 2015 and 2016.[12]
As can be attested from the data above, the trade surplus of developed countries and the trade deficit of the developing countries including LDCs have been on the decline. Furthermore, the trade deficit of the emerging economies has reduced, and there could be a trade surplus for two consecutive years. These trends explain the changing nature of global trade in agricultural implements. The locus is shifting towards developing countries given their comparative advantage, reflecting an increasing role of the Southern economies in the global trading system.
Historically, the production of agricultural implements was dominated by industrialized countries of Western Europe, however, it is now becoming dominated by the emerging industrial countries of Asia, including China.
Trends in Emerging Economies
Overall, on agricultural products, among all agricultural products groupings, emerging economies have also improved their position in recent years, both in terms of the export value and of market share. They have filled the void created by the declining share of developed countries in gross exports across product groups. This emerging trend demands a closer look at the performance of the emerging economies.
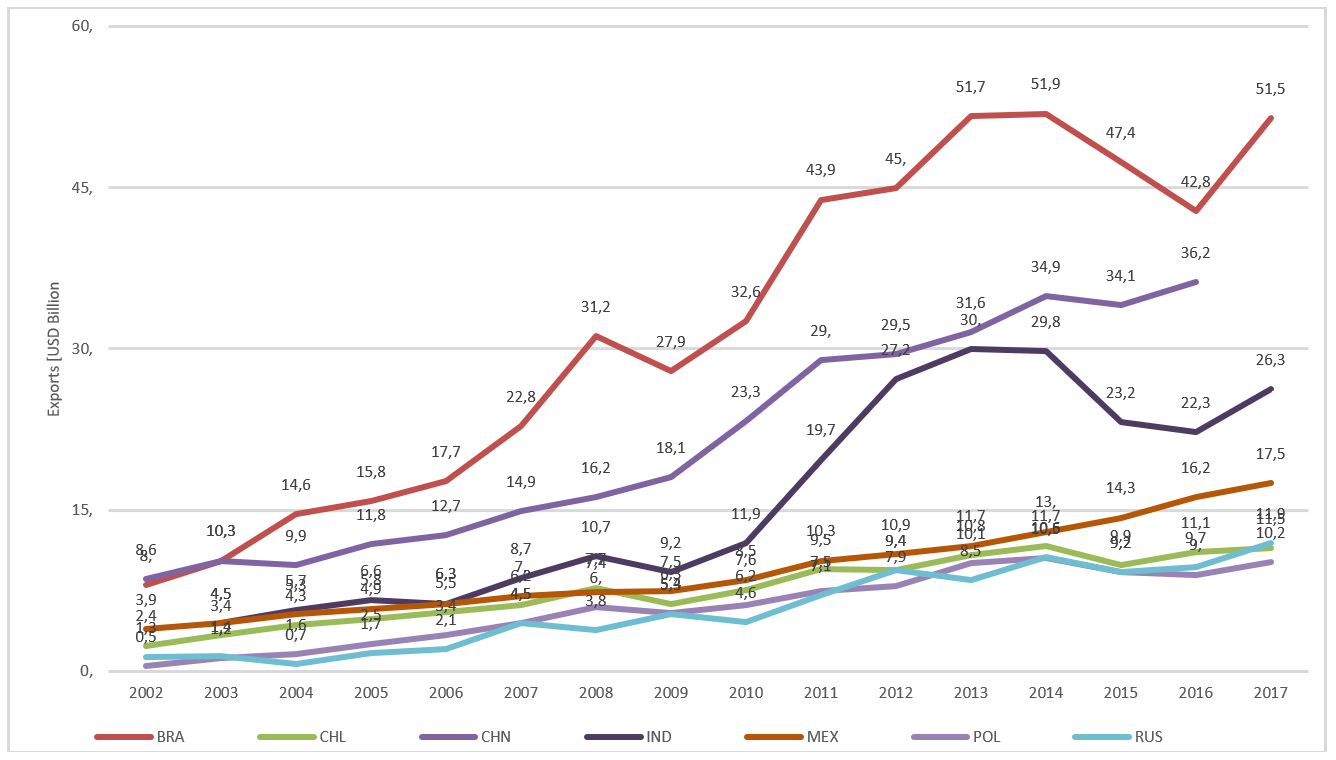
In the primary products, exports from emerging economies and their combined exports stood at 35 billion in 2003 to 165 billion dollars in 2017, and consequently, their share in emerging economies exports rose from 30 percent to 45 percent. Brazil, India, and China performed significantly well, and registered a compound annual growth rate (CAGR) of 11 percent, 12 percent, and 9 percent respectively in primary goods exports. Trends in exports of these select emerging economies are depicted in Figure 2.
Figure 2: High Performing Emerging Countries: Primary Products
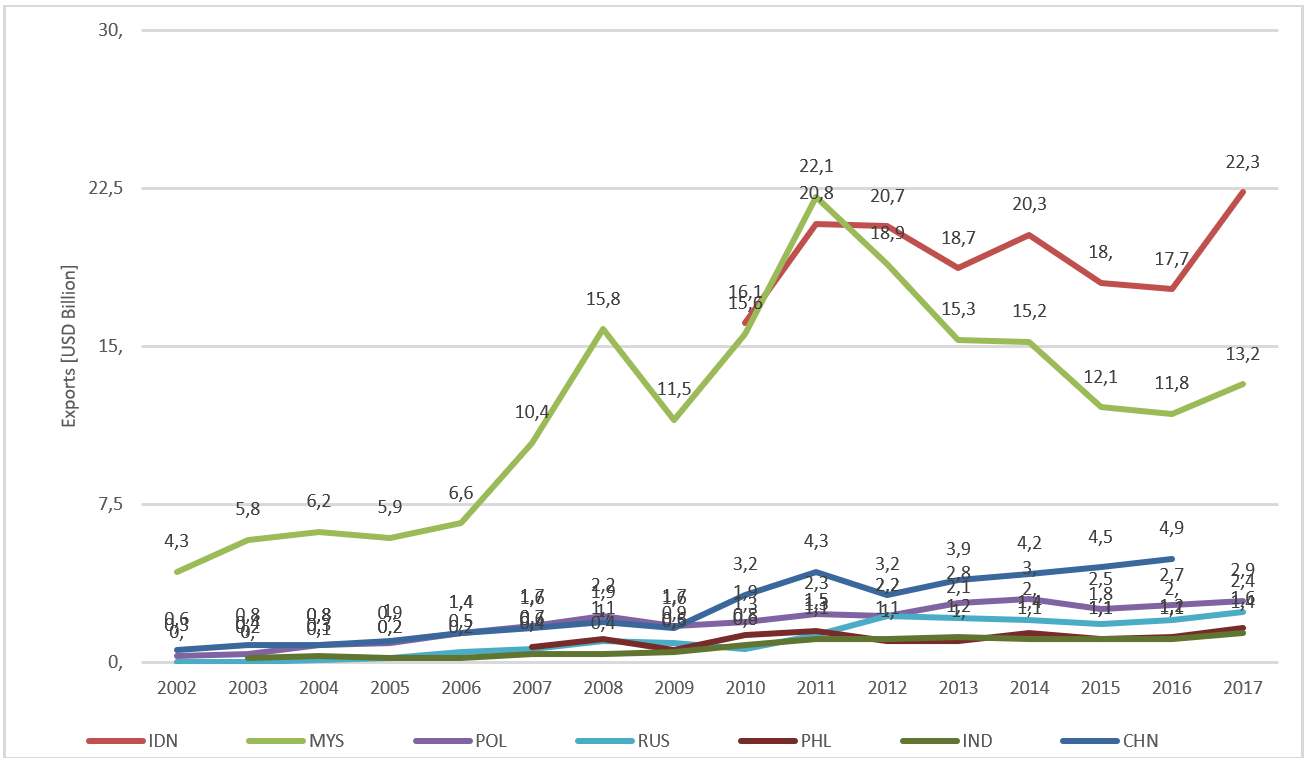
In agro-product exports, South and South East Asian Economies, including Malaysia, Indonesia, Philippines, India along with Russia, China, and Poland, were major exporters. These countries accounted for 33 percent of the total emerging market exports in 2002 and the share increased to 44 percent in 2017. Among these countries, Malaysia was an exceptional performer, followed by Indonesia. Agro-product exports from Malaysia increased from 4.3 billion in 2002 to 13.2 billion dollars in 2017, along with extraordinary spikes of exports to 15.8 billion and 22 billion dollars in 2008 and 2011, respectively. Malaysia registered an overall CAGR of 7 percent in agri-product exports whereas Indonesia registered an increased export from 16.1 billion in 2010 to 22.3 billion dollars in 2012. The export trajectory of high-performing emerging economies is given in Figure 3.
Figure 3: High Performing Emerging Countries: Agro-Based Products
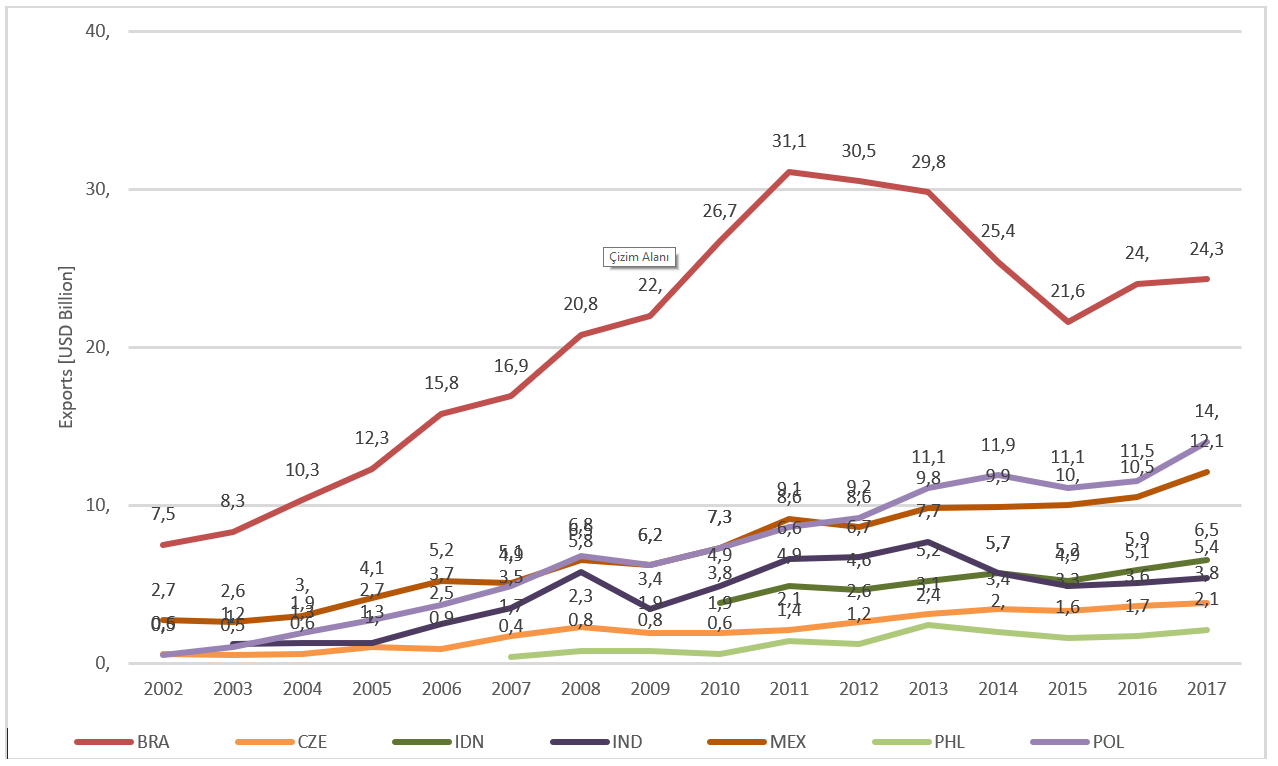
In processed food exports, Brazil, Poland, Mexico, India, Indonesia, and the Philippines are key exporters among the emerging economies. Collectively, their exports increased from 10.7 billion in 2002 to 64.4 billion dollars in 2017; thus, their share in emerging market exports increased from 15 percent to 28 percent in the same period. Among them, Brazil and Mexico were the major exporters. Brazil’s processed food exports increased from 7.5 billion in 2002 to 24.3 billion dollars in 2017 at a CAGR of 8 percent, and Mexico’s exports increased from 2.7 billion to 12.1 billion dollars during the same period at a CAGR of 10 percent. The performance of the select emerging economies is presented in Figure 4.
Figure 4: High Performing Emerging Countries: Processed Food

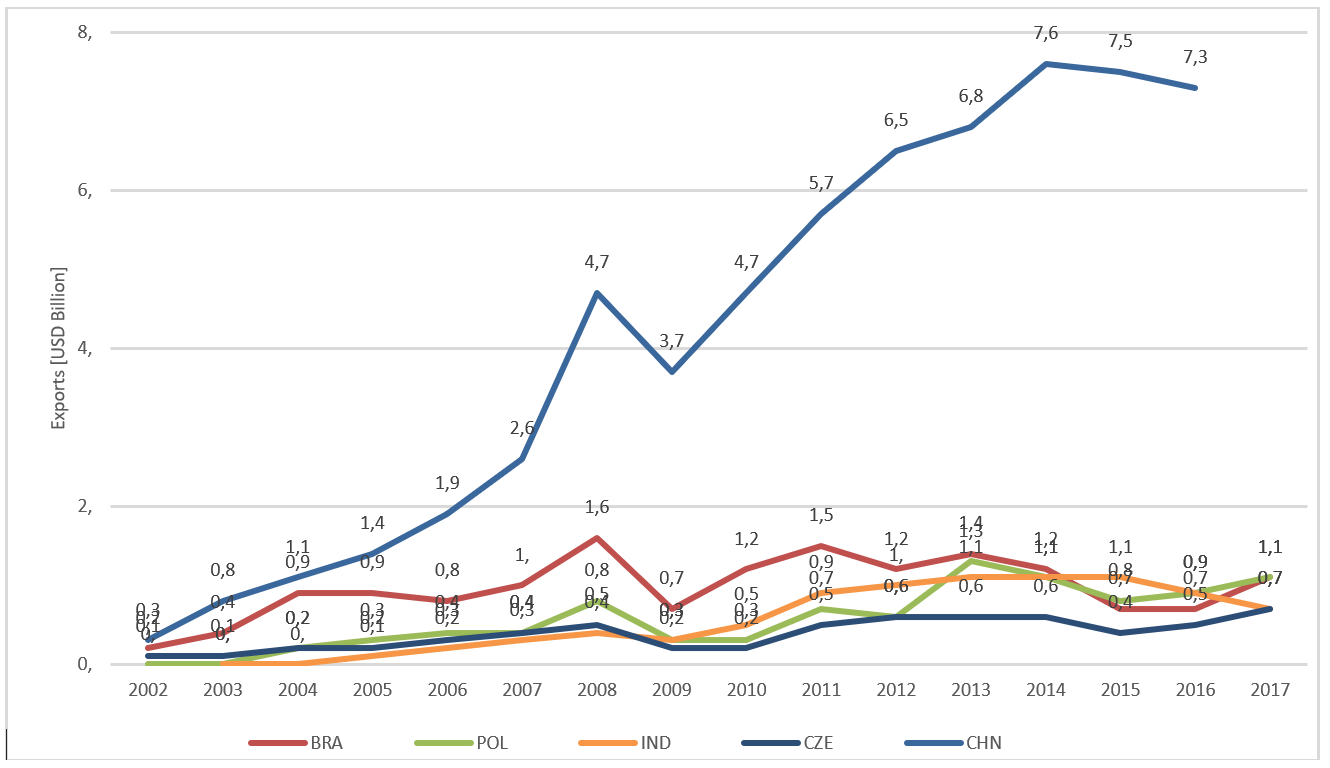
In agricultural implements exports, among all emerging economies, China has done exceptionally well, followed by Brazil, Poland, and India. Their exports increased from 0.5 billion in 2002 to 10.2 billion dollars in 2017; consequently, their exports share increased from 8 percent in 2002 to 49 percent in 2017. This was due to a surge in Chinese exports from 0.3 billion in 2002 to 7.3 billion dollars in 2017 during the entire period. Chinese exports grew at a CAGR of 22 percent, and it presently accounts for 35 percent of the emerging market exports (Figure 5).
Emerging economies have done remarkably well in the last two decades. They have been able to challenge developed countries’ dominance in the agriculture trade, but to make a leap forward, they need to improve their productivity.[13] Secondly, market access to developed countries is a challenge mainly due to Non-Tariff Barriers/Standards, especially of sanitary and phytosanitary (SPS) measures. These standards are used in a non-transparent manner, and often developing countries exporters do not have the resources (technical and financial) to comply with the standards.[14] In general, standards can act as a barrier or a catalyst depending on the sector-specific characteristics and degree of international harmonization across the standards.[15] Thus, the harmonization of standards across the region and provision of infrastructure and skills in emerging countries for complying to such standards would increase agricultural exports.
Agriculture is expected to continue to improve its share in the world trade as buoyancy returns to the world economy.
Figure 5: High Performing Emerging Countries: Agriculture Implements
Conclusion and the Way Forward
Agriculture is expected to continue to improve its share in the world trade as buoyancy returns to the world economy. If this is the case, it is expected that the share of the developed countries would reduce both in food production and machinery, and emerging economies would usurp a larger share across different product groups. However, developing countries including LDCs would still be dependent on the developed world for food security[16] while emerging economies would continue to penetrate the markets[17] both in the developed and developing countries, and in the LDCs.
Moreover, the market share of the traditional suppliers including the US, Eastern Europe, and Central Asia would expand, and thus these countries would experience a substantial rise in trade surplus in agriculture. On the other hand, the trade deficit of South and East Asia, the Middle East and North Africa would increase. Further, trade volumes would grow at a much slower pace in the forthcoming decade (2018-2027) vis-à-vis the previous one (2008-2017). New trends in the geopolitics of developed economies—themselves no longer a homogenous entity—may challenge the comparative advantage of the emerging economies. With the rise of Trump’s protectionist policies and consequent trans-Atlantic tensions, dynamics may move in a direction that were never envisaged before. Moreover, Brexit and the deceleration in Germany may have their own pulls in terms of accelerating the pace of recession in global trade, as was also predicted by the IMF’s 2019 report. Meanwhile, the conclusion of mega-regional FTAs and the renegotiation of NAFTA could lead to disruptions in global trade flows.
[1] Sachin Chaturvedi, “India’s Approach to Multilateralism and Evolving Global Order,” The Indian Foreign Affairs Journal, Vol. 13, No. 2 (2018), pp. 128-135.
[2]Ataman Aksoy and Francis Ng, “The Evolution of Agricultural Trade Flows,” The World Bank, May 2010, http://documents.worldbank.org/curated/en/468841468151476251/pdf/WPS5308.pdf
[3] Jelle Bruinsma (ed.), World agriculture: towards 2015/2030: an FAO study (Abingdon: Earthscan, 2017).
[4] Based on the Author’s calculations from the RIS database.
[5] Ataman Aksoy and John Cristopher Beghin (eds.), Global Agricultural Trade and Developing Countries (Washington DC: The World Bank, 2005).
[6] Based on the Author’s calculations from the RIS database.
[7] Prema-chandra Athukorala and Kunal Sen, “Processed Food Exports From Developing Countries: Patterns and Determinants,” Food Policy, Vol. 23, No. 1 (February 1998), pp. 41-54,
http://citeseerx.ist.psu.edu/viewdoc/download?doi=10.1.1.486.7269&rep=rep1&type=pdf
[8] Julian M. Alston and Philip G. Pardey, “Agriculture in the Global Economy,” Journal of Economic Perspectives, Vol. 28, No. 1 (Winter 2014) pp. 121-46.
[9] Jyrki Niemi and Ellen Huan-Niemi, “Global trade in agriculture inputs,” 22nd Annual International Food and Agribusiness Management Association Forum and Symposium, June 2012.
[10] Based on the Author’s calculations from the RIS database.
[11] Based on the Author’s calculations from the RIS database.
[12] Based on the Author’s calculations from the RIS database.
[13] Kym Anderson and Anna Strutt, “Emerging economies, productivity growth and trade with resource-rich economies by 2030,” Australian Journal of Agricultural and Resource Economics, Vol. 58, No. 4 (2014), pp. 590-606.
[14] Juthathip Jongwanich, “The impact of food safety standards on processed food exports from developing countries,” Food Policy, Vol. 34, No. 5 (April 2009), pp. 447-457.
[15] Ben Shepherd and Norbert L.W. Wilson, “Product standards and developing countries agriculture exports: The case of European Union,” Food Policy, Vol. 42 (October 2013), pp. 1-10.
[16] Jonathan Brooks, “Policy coherence and food security: The effects of OECD countries’ agricultural policies,” Food Policy, Vol. 44 (2014), pp. 88-94.
[17] Sachin Chaturvedi, “How to cut across corridors,” The Economic Times, 14 June 2017, https://economictimes.indiatimes.com/blogs/et-commentary/how-to-cut-across-corridors/